Permits up 11% in the first half of 2026
Greece issued 15,235 building permits between January and June 2026, 1,508 more than the 13,727 issued in the same months of 2025 (+11.0%). Five of the six months came in above last year, and May was the only one below. June was the strongest month of the period, at 3,118 permits. The floor area those permits cover grew faster still, up 27.7% to 3.44 million m².
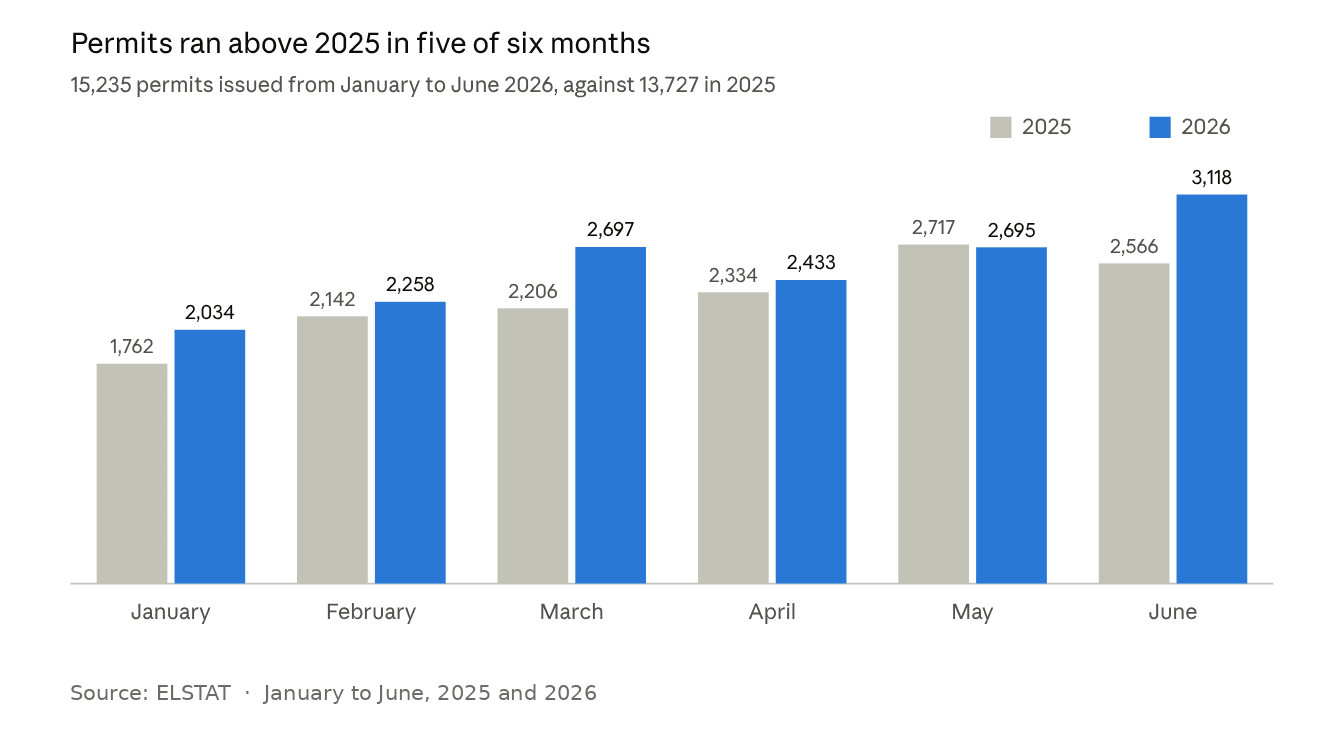 Monthly output averaged 2,539 permits, against 2,288 a year earlier. June's 3,118 is the highest figure in either year, while January's 2,034 was the lowest of 2026.
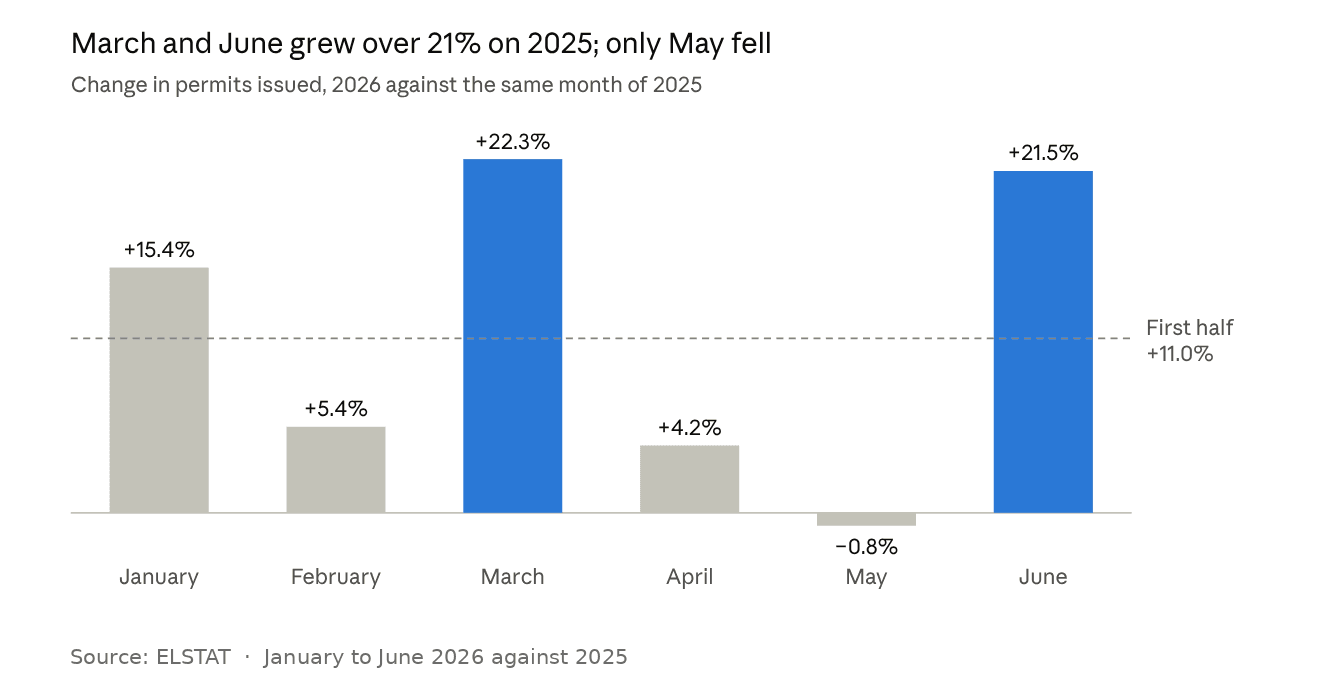 March (+491 permits) and June (+552) supply 1,043 of the 1,508 extra permits, about 69% of the gain. May slipped by 22 permits, while February (+5.4%) and April (+4.2%) grew only modestly. By quarter, growth was +14.4% in the first and +8.3% in the second.
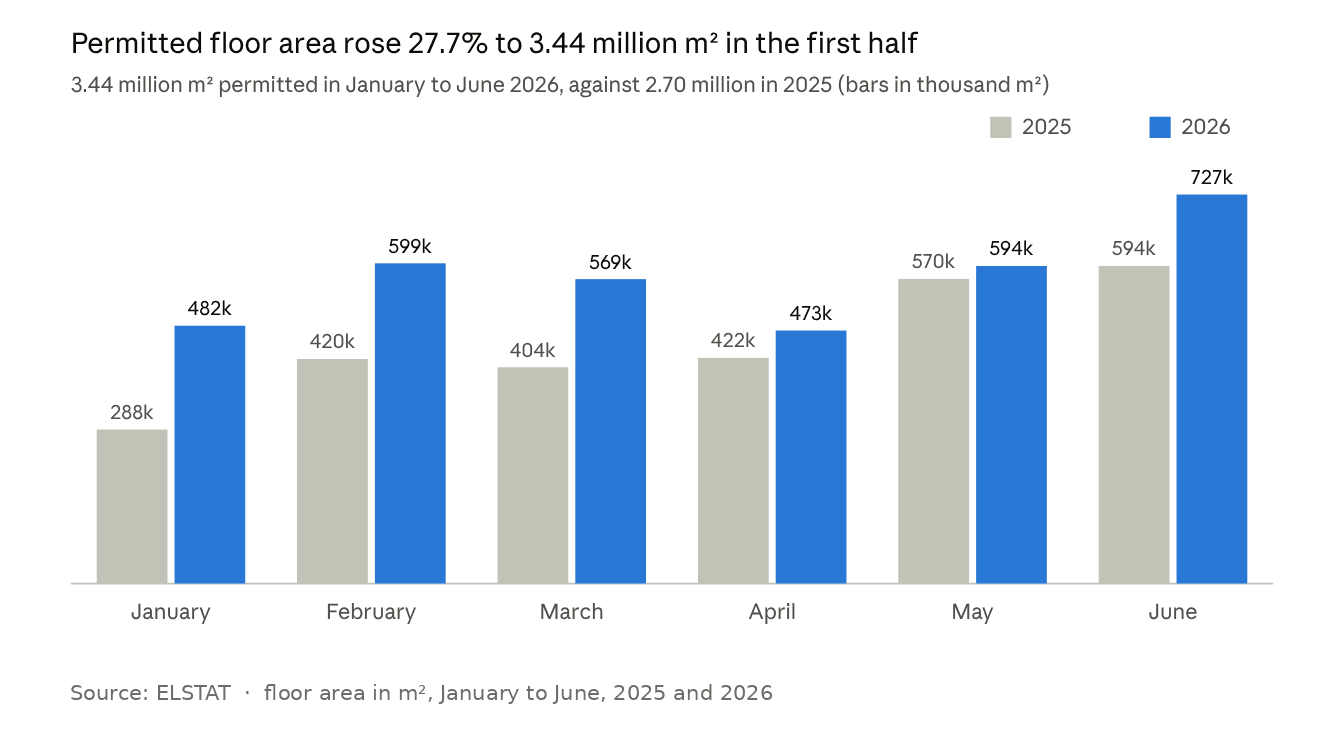 Permitted floor area was 746,008 m² higher than in the first half of 2025, with the largest increases in January (+67.3%) and February (+42.6%). June was the highest month in either year, at 727,203 m².
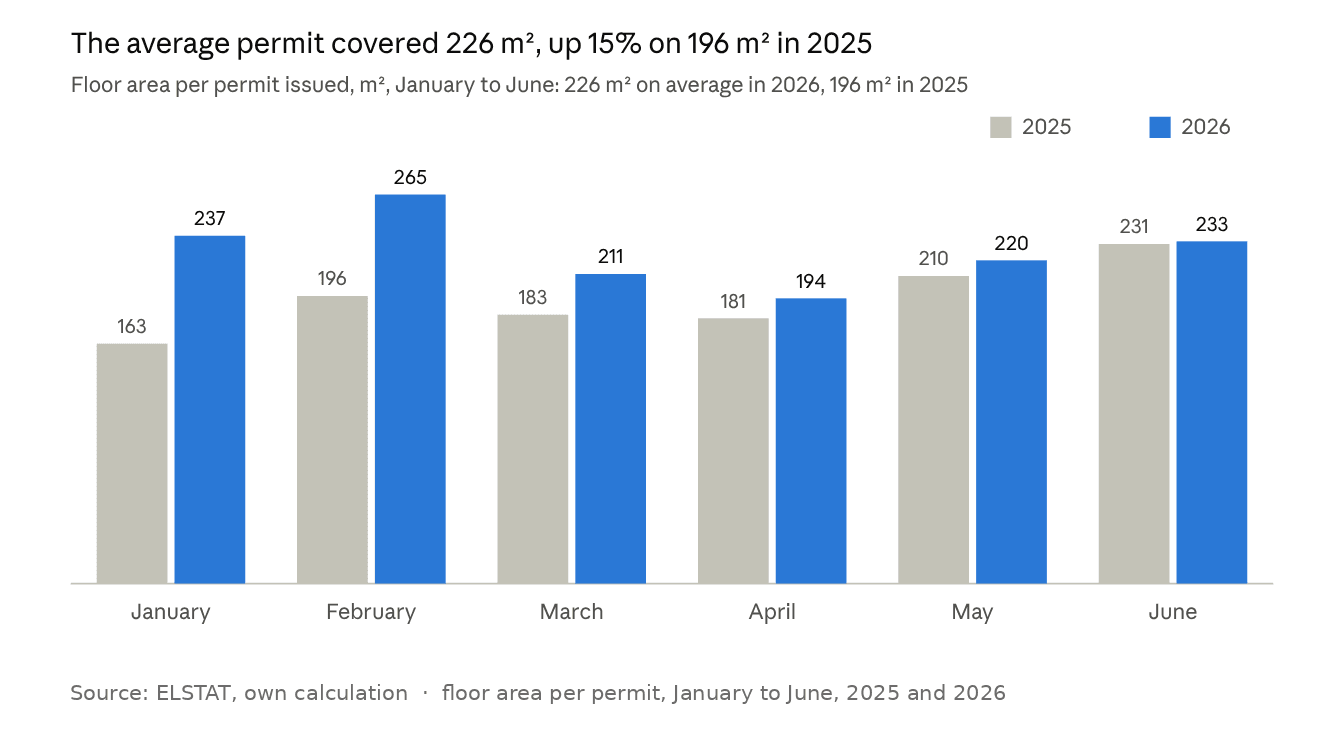 Floor area grew faster than the number of permits in every month, so the average permit covered more space: 226 m² against 196 m² (+15%). The gap was widest early in the year (January: 237 m² against 163 m²) and had almost closed by June (233 m² against 231 m²). In May, permits fell 0.8% while floor area rose 4.2%.
What the data covers
The figures run from January to June 2026 and are compared with the same months of 2025. July, August and September are marked as not yet released in the source file, so this is a half-year picture and the totals will be updated once those months are published.
Rent growth slowed to 6.2% by August 2026
Annual rent growth in August 2026 was 6.2%, against 10.9% in August 2025. The figures show payments made for housing as a percentage change on the same month of the previous year, so rents are still rising, only more slowly. The data run from January to August.
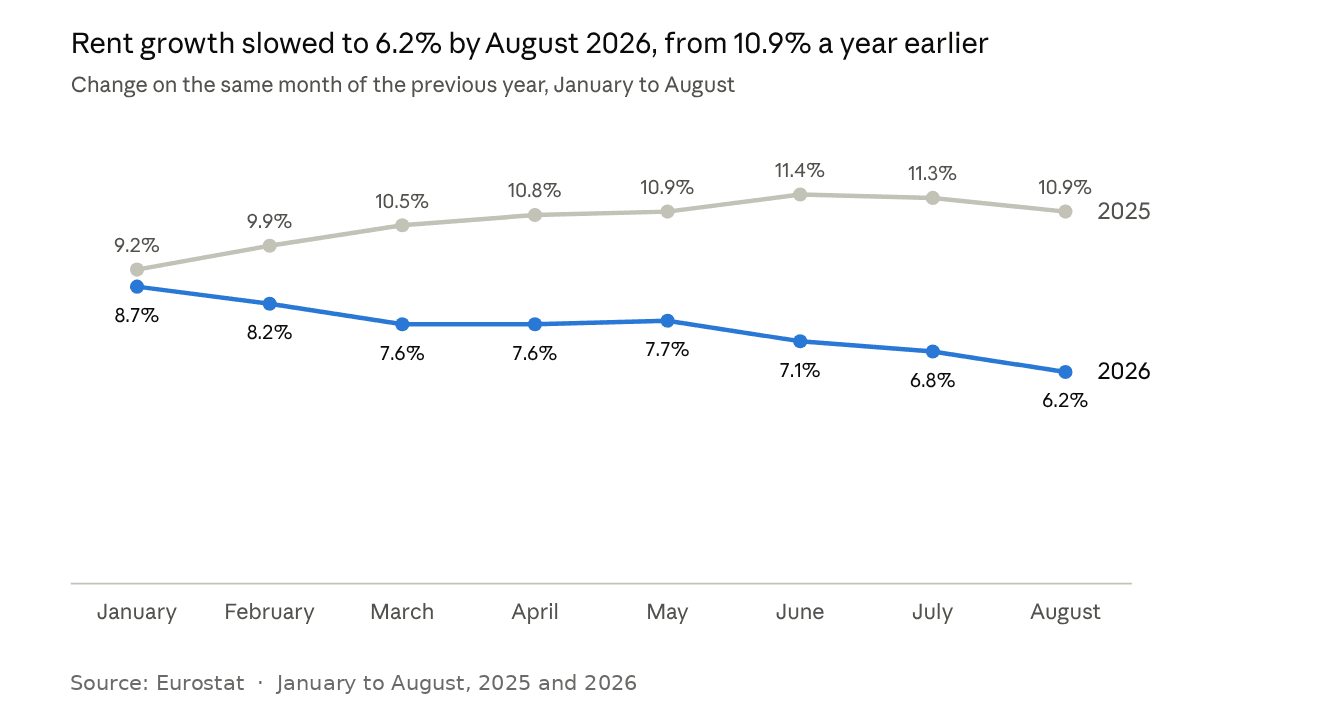 Growth rose through the first half of 2025 to a peak of 11.4% in June, then eased to 10.9% by August. In 2026 it began lower, at 8.7% in January, and has slowed to 6.2% by August, the lowest reading in the series.
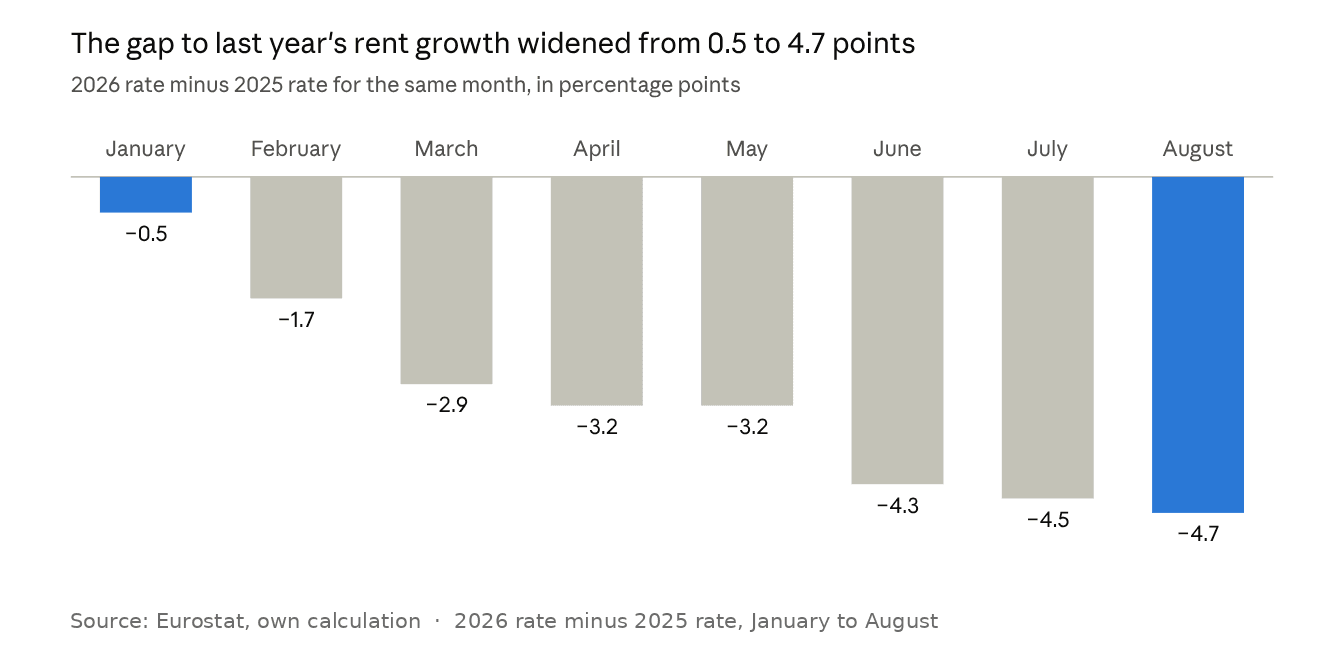 Each bar is the 2026 rate minus the 2025 rate for the same month, in percentage points. The gap widened from 0.5 points in January to 4.7 in August, with the biggest steps in February and March (1.2 points each) and in June (1.1). In relative terms, August's 6.2% is 43% below August 2025's 10.9%.
Construction prices are picking up again
Construction prices of residential buildings were 2.9% higher in the second quarter of 2026 than a year earlier, the highest reading since the first quarter of 2025. The rate fell for three quarters to 2.1% in Q3 2025, then rose for three. The data cover the six quarters from Q1 2025 to Q2 2026.
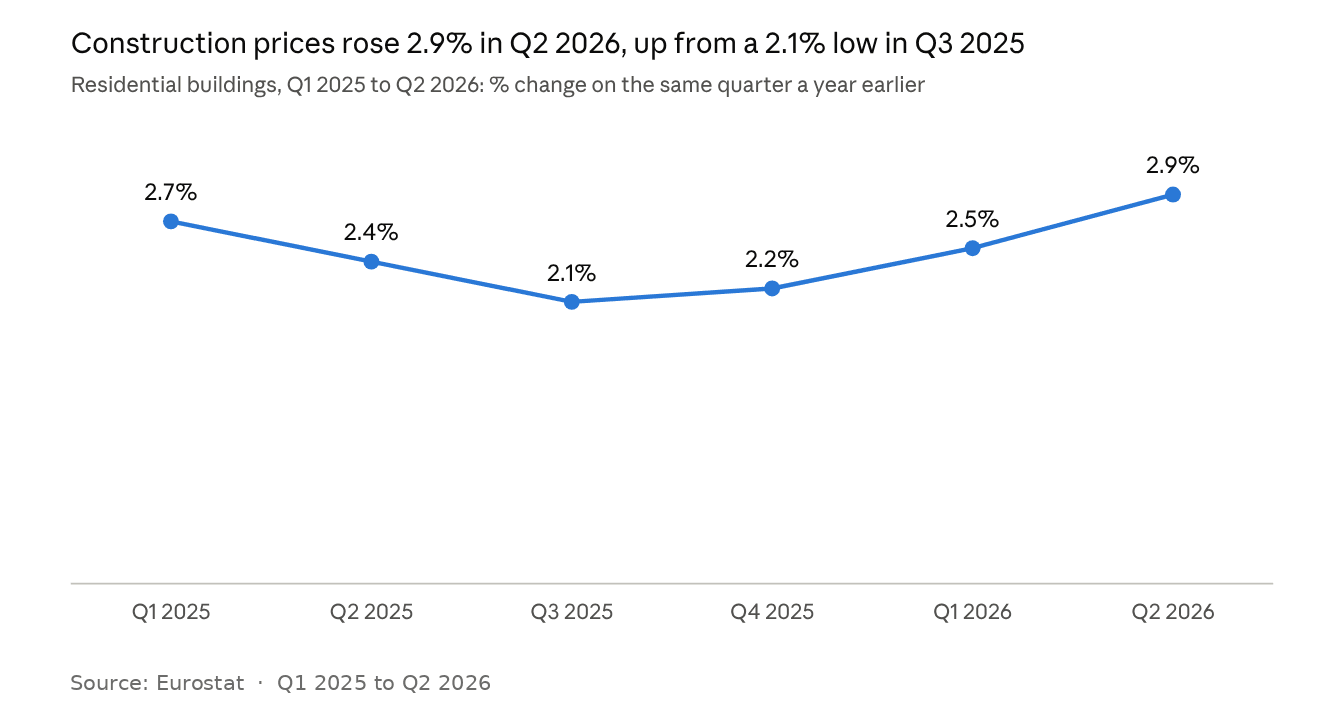 The rate slipped from 2.7% in Q1 2025 to 2.1% in Q3, then climbed back through Q4 (2.2%) and the first half of 2026 (2.5% and 2.9%). The 0.8-point rise from the Q3 2025 low is larger than the 0.6-point fall that preceded it. This runs against rents, where annual growth slowed over the same period.
Conclusion
Building activity is picking up while rent growth cools and construction costs firm up.
Bigger projects, not just more of them. Permits rose 11.0% in the first half, but floor area rose 27.7% and the average permit grew from 196 m² to 226 m². By June that size effect had faded (233 m² against 231 m²), so the latest gains come from the number of permits.
Rent pressure is easing. Annual rent growth fell from 8.7% in January to 6.2% in August 2026, 4.7 points below the same month of 2025. Rents are still rising, only more slowly.
Building is getting more expensive. Construction prices were 2.9% above a year earlier in Q2 2026, up from 2.1% in Q3 2025, the opposite direction to rent growth.
Together these describe a larger pipeline, slower rent growth and firmer building costs, a combination developers will be watching. Permits take time to become finished homes, so they do not explain the rent slowdown so far.
The three data sets cover different periods (permits to June, rents to August, construction costs to Q2), so they show trends rather than one picture. Next to watch: the July to September permits once released, and whether rent growth keeps slowing.
DKG Development, building permits, rents and construction costs in Greece, October 2026. Underlying data: ELSTAT (building permits) and Eurostat (rents and construction costs).